


Introduction:
Have you ever noticed how algorithms recommend movies you might like or predict traffic patterns? These are just a few examples of linear regression in action! Before we delve into this powerful technique, let's take a quick refresher on some terms and notation that we will be using.
well, if you want to learn about types of models in machine learning you can read my article here
Terminology:
Training Set: Data used to train the model
w (weight): This controls the slope of the line. A higher w makes the line steeper.
b (bias): This controls where the line crosses the y-axis.
we will discuss w & b in the cost function
Notation:
x = Input variable (feature)
y = Output variable (target)
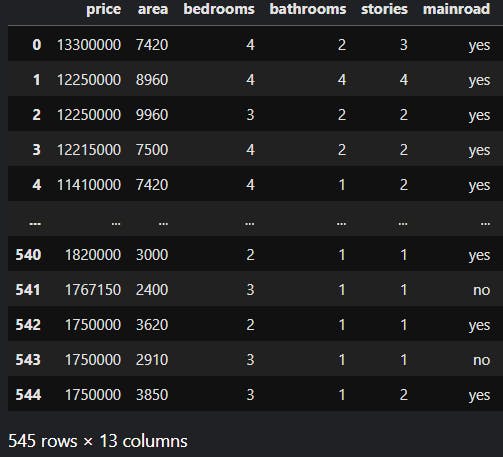
m = Number of training examples
For example, if we have 545 rows in our training set, we will refer to it as 'm'.
(x,y): Single training example
(x^i,y^i): i^th training example, 'i' here refers to the specific row in the table
y-hat: it is the estimation or prediction for y
Regression Model
Linear Regression is currently the most widely used learning algorithm in the world. It is a specific type of supervised learning. The linear Regression Model is one example of the Regression Model, there are other models too but we will explore them in a different blog. For now, our focus is on the Linear Regression Model.
The Regression Model predicts numerical values. Any supervised learning model that predicts numbers is addressing what is called a regression model.
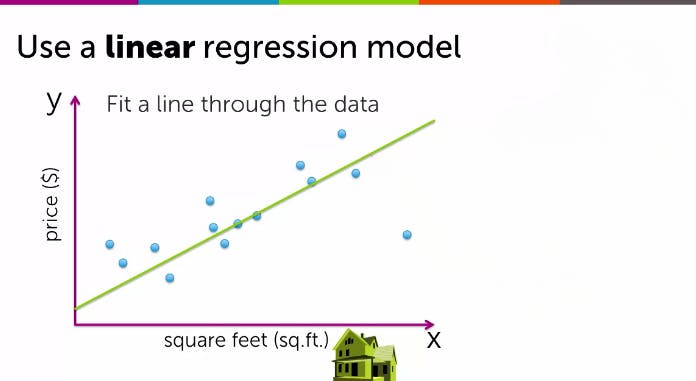
Let's consider the example of house size and price. Suppose you are a seller and a client approaches you to estimate the price of their house based on its size, which in this case is 1250 square feet. The price of the house is $220,000, and in this scenario, the size is the feature (input), and the price is the target (output). The target you predict is the numerical value of the price. The model you will use to estimate the price is the Linear Regression Model.
To train the Regression model, we need to input both feature and target values into the learning algorithm. The resulting outputs are the correct answers for the model to learn from.
This Algorithm produces the function(f)
feature(x) -> model(f) -> y-hat(prediction estimated y(target))
in this example, size -> function(f) -> price estimated
How do you represent F(x)?

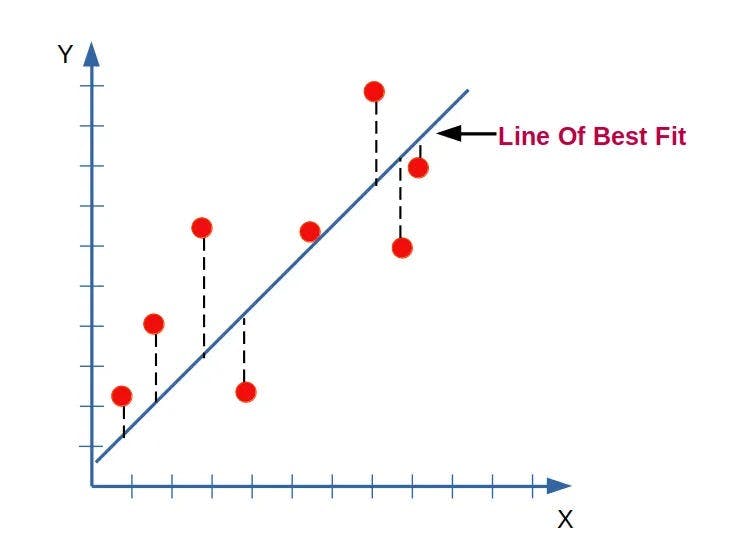
The Line of Best Fit:
When visualizing a training set, it is common to use a graph where the input or feature is represented on the X-axis, and the output or target on the Y-axis. The algorithm analyzes this data to identify patterns and relationships between the inputs and outputs and generates a best-fit line that accurately represents the data.
This model is a linear regression model with one variable(single input variable/feature(x)) another name for this is also univariate linear regression. here we are only taking one input which is house size
Cost Function for linear regression with univariant
cost function helps us to know how well the model is doing so that we can try to get it to do better
The parameters are the variables you can adjust during training to improve the model
What do w,b do?: finding the best fit
on choosing the different values for w & b we get the different graph for f(x)
what we want to do here is to choose the values for w, and b so that the straight line you get from the function f somehow fits the data well
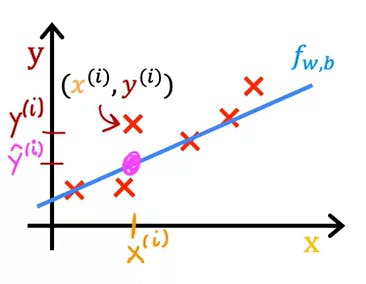
here the y-hat is estimating the price of the house as we have seen in the above example
here, y-hat is equal to f(x)

How do you find the value of w,b?
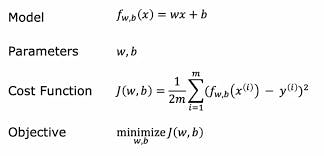
To find the values for parameters w and b, we first need to measure how well the line can fit the data.
To do this, we can construct a cost function.
- Squared Errors:
We calculate the difference between the predicted value (y-hat) and the actual value (y) for each data point in the training set.
we square these differences. Squaring ensures positive values for the errors, and larger errors contribute more significantly to the cost function.
- Summing the Errors:
- We don't just consider the error for one data point. We add up the squared errors for all data points in your training set.
- Averaging the Errors (Optional):
- To account for the number of data points in the training set, we often take the average of the summed squared errors. This is why it's called the Mean Squared Error.
MSE = (1/m) * Σ(y_i - ŷ_i)^2

As we already know Y-hat = f(x)
The cost function is also known as the squared error function.
The lower the cost function value, the better the model is.
Cost Function Intuition: what J(w,b) is really computing
J(w, b) computes the total error between the line your model creates and the actual data points.
The goal is to minimize the J(w,b).
Selecting a value for w that minimizes J(w) leads to a well-fitted model, resulting in a line that accurately fits the training data when b=Φ
In a more general scenario with parameters w and b, the objective is to determine the values of w and b that minimize J. By adjusting w or both w and b, different straight lines are obtained, and when one of these lines closely aligns with the data points, J is minimized.
In simpler terms:
J(w, b) tells you how wrong your model's predictions are on average.
A lower cost means your line is closer to the actual data points.
Summary
Thanks for reading this article! If you have any feedback or questions, drop them in the comments and I'll get back to you.
connect with me on Twitter, Linkedin, and Hashnode. Let's stay in touch :)!!